How to Research Phoenix Crime Data Before Buying a Home
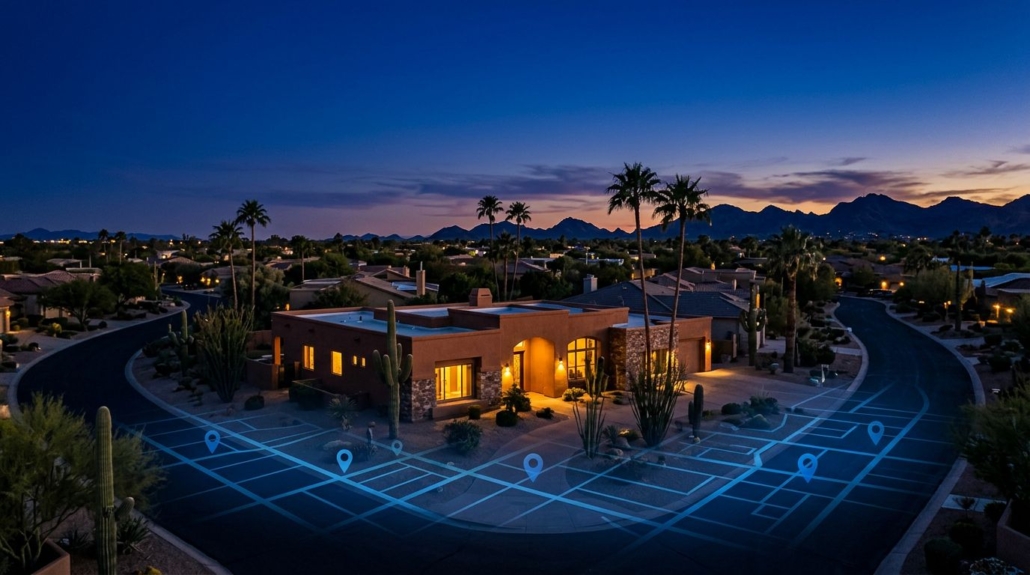
One red dot on a crime map doesn’t tell you whether a house is a bad buy. It shows that something happened nearby, at some point, and needs more context.
That is why Phoenix crime data should be a starting point, not a verdict on a family home. Phoenix is a big city, and broad numbers can hide the difference between a busy commercial corridor and a quiet residential pocket.
I’ve helped a lot of families through this exact situation. Let’s walk through how I would research it before you make a decision.
Key Takeaways
- Use the exact property address as your starting point instead of relying on a Phoenix-wide crime rate.
- Review the last 12 months of Phoenix Police data, then widen the map to see whether incidents cluster near the home, a major road, or a commercial destination.
- Read crime categories carefully, especially when comparing newer NIBRS data with older UCR statistics. Changes in labels and counting methods can make the numbers difficult to compare directly.
- Treat arrests, clearance rates, online safety rankings, and booking totals as context—not measures of the likelihood of crime on a particular street.
- Use focused public records requests and visits at different times of day to fill gaps the map cannot answer.
Start with the address, not a citywide rate
Phoenix-wide crime rates are useful background, but they are not a neighborhood report card.
A property near a freeway, hospital, mall, light-rail stop, or large parking lot can sit close to more reported incidents than a home a few blocks away. That doesn’t automatically mean either street is unsafe. It means you need to see what is happening, where it is happening, and when.
This matters in places like the Sheaborhood in 85028, North Central Phoenix in 85021, Arcadia in 85018, and Biltmore in 85016. Each area includes quieter residential blocks, busier roads, and commercial activity. A pin on a map without that local context can create more worry than clarity.
This is the kind of address-level crime analysis I do with buyers. I want to know:
- Whether incidents cluster near the actual home or along a nearby arterial street.
- What kinds of property crime appear repeatedly, rather than treating every report the same.
- Whether reports occur during school drop-off, late-night business hours, or at random times.
- If the pattern has changed during the past year or has been there for several years.
A map pin near a shopping center, park, or major road is not the same thing as a pattern on the street where you plan to live.
For families and downsizers, I also look at the practical stuff. Is the home well-lit at night? Is there steady foot traffic? Does the street feel cared for? The numbers matter, but they are one piece of a much larger decision.
Where to find local crime data before a home purchase
The best place to start is the Phoenix Police Department’s crime maps and data page.

The page offers crime mapping tools, including a community crime map. Buyers can search an address and review current and archived reporting.
For a useful crime analysis, search the address, then widen the view a little. A half-mile view can show whether a report is tied to the home, the block, or a nearby destination that draws traffic.
To identify local crime trends, start with the last 12 months. Looking at only the previous 30 days is like judging a restaurant after one Tuesday lunch. Pull back farther when a pattern needs more context.
The useful questions are pretty simple:
- Are most incidents categorized as property crime, such as vehicle theft or burglary?
- Do crimes against persons appear repeatedly in the same small area?
- Is the activity concentrated around an intersection, apartment complex, retail center, or trailhead?
- Does the map show a one-off event or an ongoing problem?
Phoenix Police began reporting under the National Incident-Based Reporting System, or NIBRS, in September 2025. The department moved away from the older UCR Summary Reporting System in January 2026. This change matters when comparing a current map or monthly report with older Phoenix crime statistics.
The City’s page also makes an important point: if you need a specific statistic that isn’t published, you’ll need to ask the City for it. More on that in a minute.
Read NIBRS categories without mixing them up
The old reporting system grouped major offenses under broad labels, including violent crime and property crime. NIBRS records more detail about each incident.
Under NIBRS, offenses generally fall into three main groups:
- Crimes against persons, including offenses such as aggravated assault, robbery, and homicide.
- Crimes against property, including burglary, theft, and motor vehicle theft.
- Crimes against society, which include offenses where there may not be a direct victim in the usual sense.
The FBI’s NIBRS overview helps explain this change within the FBI Uniform Crime Reporting program. NIBRS can record multiple offenses within one incident. The older summary system often counted only the most serious offense in an event.
That distinction matters when you review robbery statistics: a 2026 Phoenix total should not be dropped beside an older UCR total and treated as an apples-to-apples trend line. The labels changed, and the way incidents are counted changed too.
I also wouldn’t confuse clearance rates with safety. A case can be cleared through an arrest or another official outcome. A clearance number tells you something about case resolution. It does not tell you the likelihood of an incident near your home.
Compare Phoenix crime data with some common sense
Phoenix has had real violent crime challenges over the decades. The city saw high violent crime and motor vehicle theft during parts of the 1980s and 1990s. Crime levels generally fell later, though the path was not a straight line and some years moved the wrong direction.
That history is useful background, but it is not a substitute for current, address-level research. It is not a reason to use a 30-year-old citywide statistic to judge a home in 85020 or 85032 today.
When people compare Phoenix with Scottsdale, Mesa, Glendale, or another Arizona city, I slow the conversation down. Start with comparable crime statistics from the same reporting year and source, then compare crime rates per 100,000 residents. Then verify that the law enforcement agencies involved used the same reporting system. Even burglary rates require comparable geography, population, and reporting practices.
City boundaries matter because Phoenix contains dense urban areas, large employment centers, freeways, industrial zones, stadium traffic, and vast residential areas. Online safety rankings can obscure these differences, so treat them as a starting point, not a verdict. Another city’s rate may cover a much different mix of places.
Criminal arrests and arrest records need the same caution. An arrest is an enforcement action, not a conviction. It does not show whether criminal charges were filed or how the case ended.
Booking totals, including misdemeanor bookings, can reflect enforcement priorities, booking practices, reporting practices, and where calls for service occur. They do not measure the probability of crime on a particular street.
Do not compare arrest demographics with Census demographic data and draw a safety conclusion. That’s not what those numbers can tell you.
For a house purchase, the better question is smaller: What has been reported near this address, and does the pattern concern me based on how my family will use the area?
Request records when the public map leaves gaps
Sometimes a map raises a fair question that published data cannot answer. Maybe a buyer notices repeated reports near a particular intersection. Maybe an adult child wants more detail before moving a parent into a lower-maintenance home nearby.
A public records request is the next step. Keep it focused. Broad requests can take longer and return more paperwork than anyone wants to sort through.
Include the following details:
- Give the exact address or the smallest practical area, such as a named intersection or a few blocks.
- State the date range you need, such as January through December of the prior year.
- Identify the records source and type, such as police calls for service, offense reports, or a count by offense type. If your question concerns jail activity, request misdemeanor bookings from the Maricopa County jail.
- Ask for an electronic file if one is available.
A narrowly scoped request is easier to process and easier for a buyer to interpret. You may need to pay a copying or processing fee, depending on the request.
Some information can also be withheld or redacted to protect victims, minors, active investigations, or private details. Records availability may vary based on the agency and the type of information requested.
This is where people get stuck. They ask for “all crime near this house” and get overwhelmed. A narrow request tied to a time period and a specific concern is usually more useful.
Visit at the times that matter
Data can narrow your questions. It cannot replace being there.
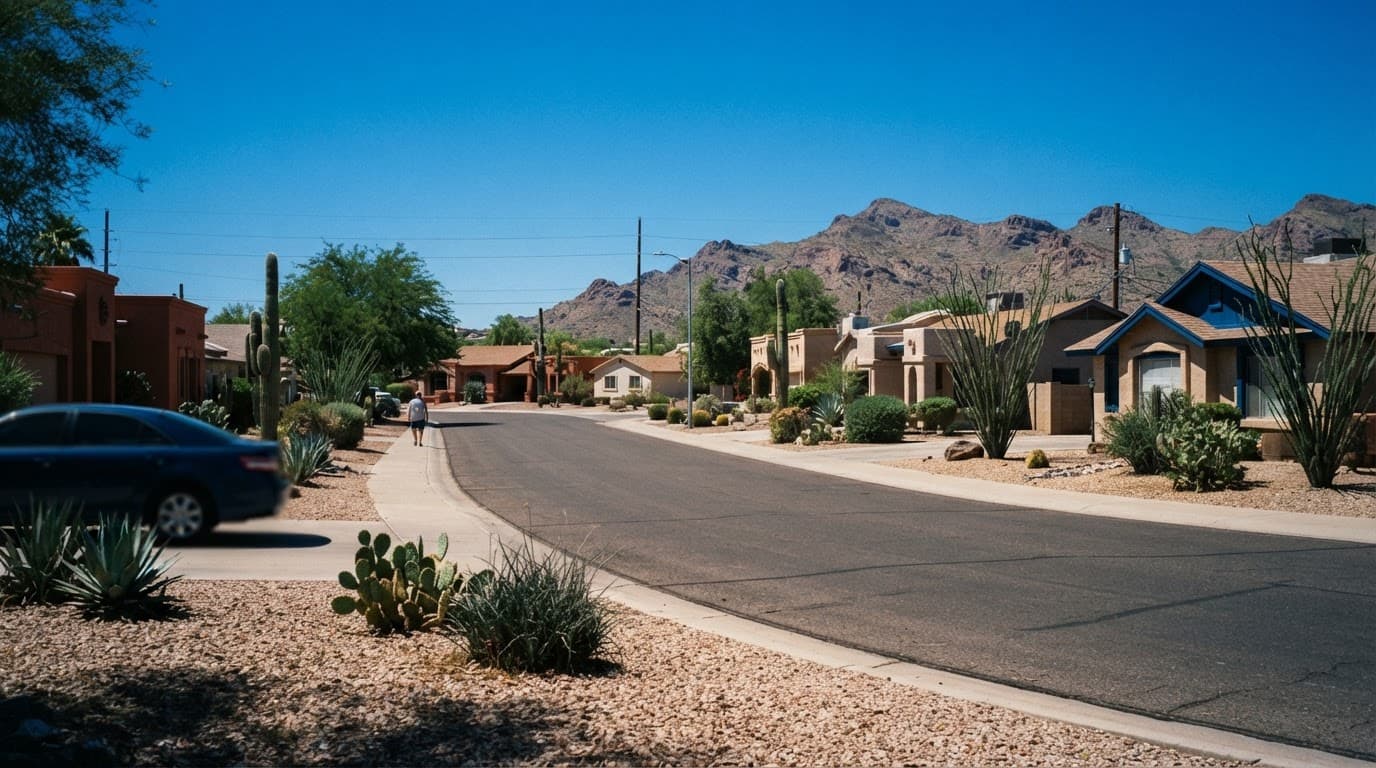
I like buyers to see a possible home at least twice, preferably at different times. Visit during weekday traffic, after dark, and on a weekend morning if you can. You may notice things a map cannot show, such as cut-through traffic, poor lighting, barking dogs, parking pressure, or a street that becomes a shortcut at rush hour.
If you are considering the Sheaborhood, pay attention to how close the home is to Shea Boulevard, Cactus Road, or Tatum Boulevard. In Arcadia, Biltmore, Uptown, or the Magic Zip Code in 85254, notice the relationship between the house and nearby commercial activity. The same rule applies in Paradise Valley, where a secluded street can feel very different from a home near a busy connector road.
For a broader fit beyond one safety concern, my guide to the best Phoenix neighborhoods for families can help you weigh parks, schools, traffic, and day-to-day feel alongside the map.
Frequently Asked Questions
How should I start researching Phoenix crime data?
Search the exact address on the Phoenix Police crime map and begin with the previous 12 months. Then widen the view to determine whether reports are tied to the home, nearby streets, or a commercial area that draws more activity.
Does one crime map pin mean a neighborhood is unsafe?
Not necessarily. A single report may be connected to a freeway, shopping center, apartment complex, or other nearby destination rather than a pattern on the residential street.
Can I compare Phoenix crime rates with Scottsdale or Mesa?
You can, but use statistics from the same year and source, with comparable geography and population. Also confirm that the agencies used the same reporting system, since NIBRS and older UCR data may count and label incidents differently.
What should I do if the public crime map leaves questions unanswered?
Submit a focused public records request that identifies the address or smallest practical area, date range, and record type you need. Asking for an electronic file can make the response easier to review, although some information may be withheld or redacted.
Should I visit the neighborhood before buying a home?
Yes. Visit during weekday traffic, after dark, and on a weekend morning if possible so you can observe lighting, parking, traffic, noise, and the overall condition of the street.
A calmer way to make the call
Understanding Phoenix Crime Data in Your Neighborhood
Phoenix crime data is useful when you treat it as evidence, not a verdict. Look at the exact location, the type of reported activity, the time period, and the real-world feel of the street.
A house should not be rejected because of one scary-looking pin. It also should not get a pass because a citywide average looks fine. Good decisions come from looking close, asking better questions, and giving yourself time to see the whole picture.